.svg)
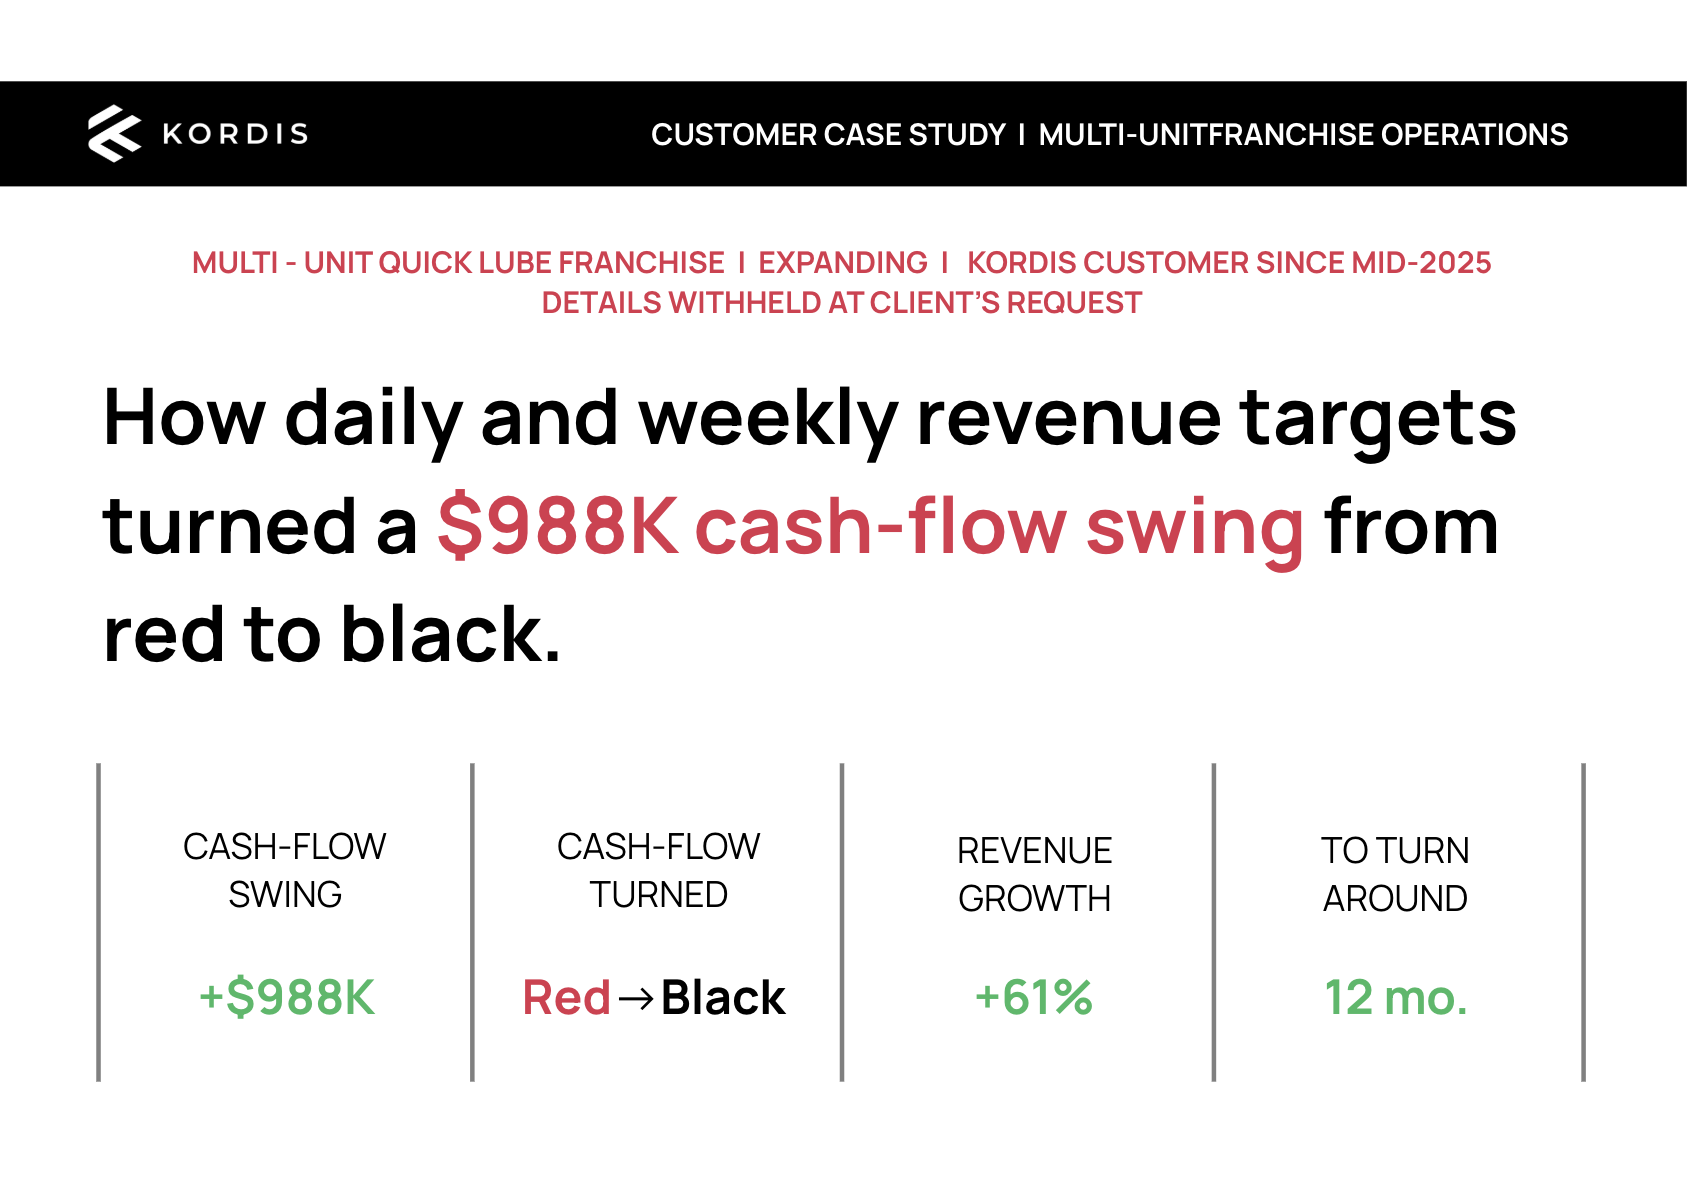
This Kordis customer is a heavy-duty repair shop serving regional fleets. In FY 2025 the shop was busy but finished the year at a net loss. Labor leakage on invoices and slow-paying fleet accounts were quietly eating the margin. Since joining Kordis in April 2025, they've more than doubled revenue and grown the team from 5 to 11 technicians. Here's how.
.svg)
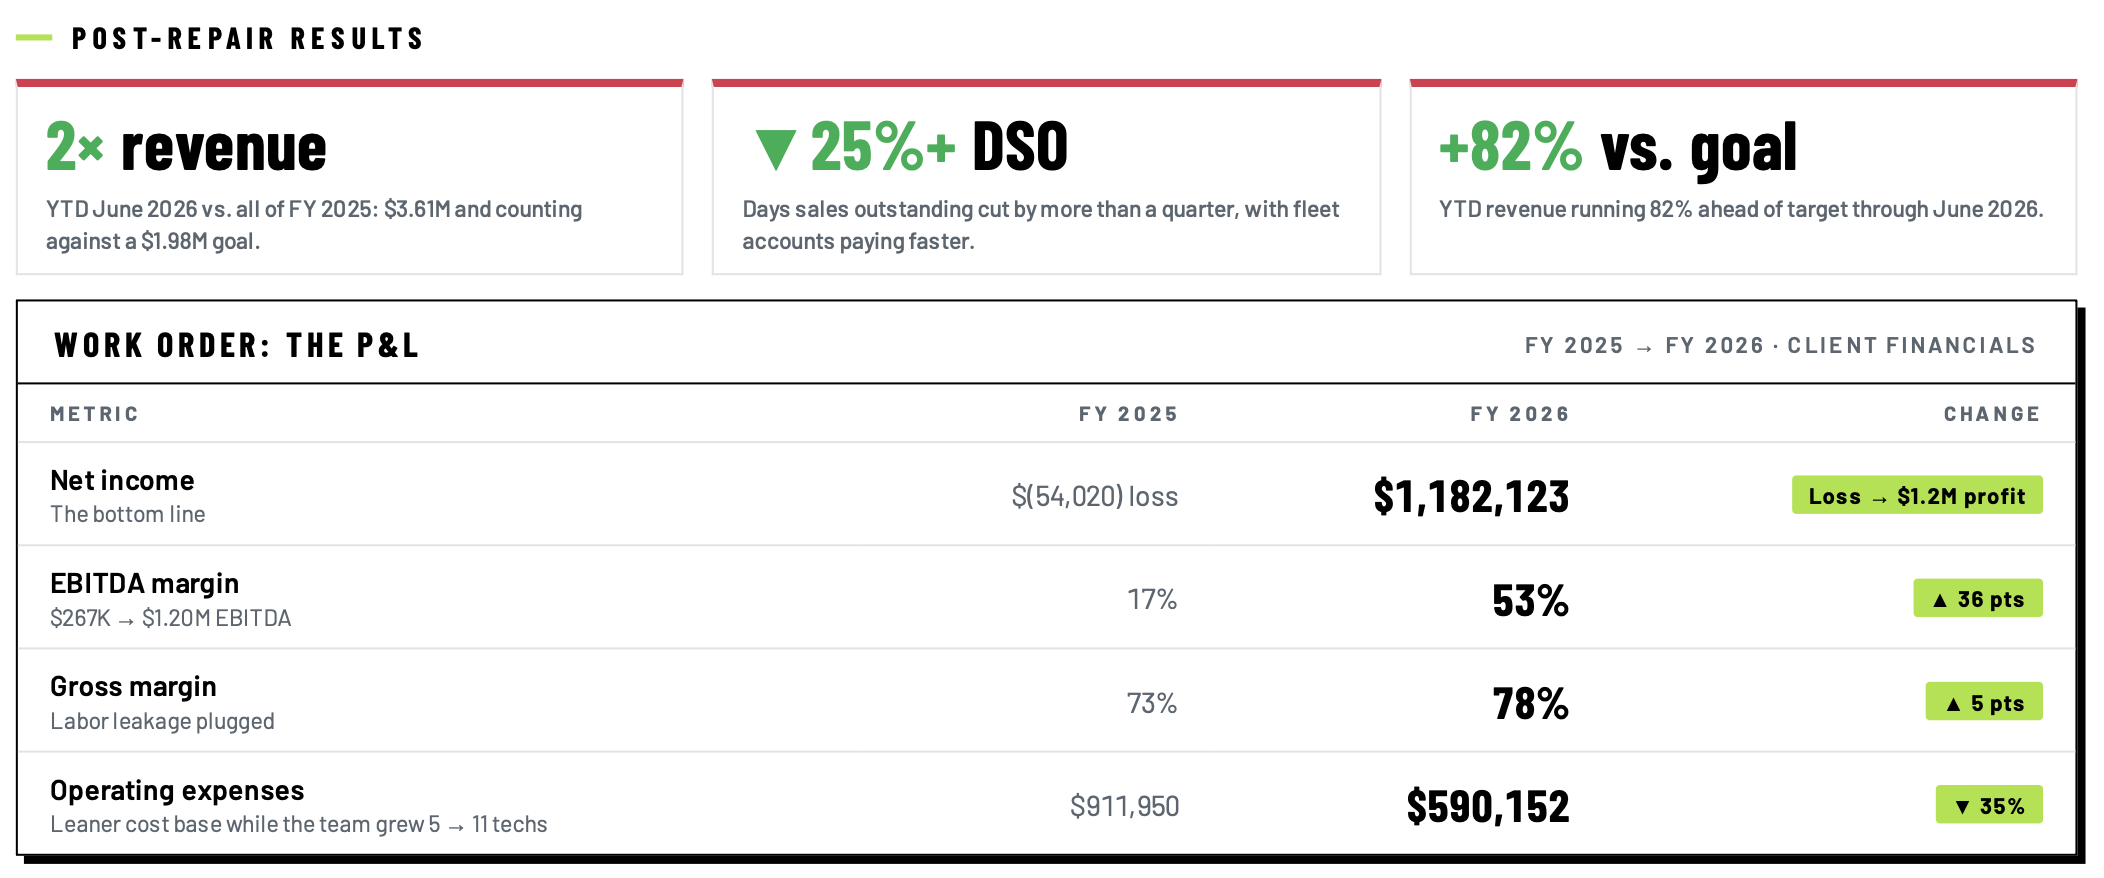
The shop was busy and gross margins looked healthy, but FY 2025 still ended at a $(54K) net loss. The culprits were invisible in QuickBooks: jobs where techs tracked far more hours than were billed (single invoices leaking $1,500 to $6,000 in labor), no view of profitability by technician, and fleet accounts drifting well past terms.
Kordis flags the jobs where hours walk out the door unbilled, including outliers losing 20, 30, 40+ hours, so they get caught before the invoice goes out, not at year-end.
Net revenue and gross profit per tech exposed a GP% spread across the team from 29% to 100%, turning pricing and coaching into a data conversation.
A YTD tracker against monthly targets, with the AI CFO flagging fleet accounts as they slip, so collections happen while invoices are fresh.
We thought we had a revenue problem. Kordis showed us we had a leakage problem: hours we were paying for but never billing.
Owner, Heavy-Duty Fleet Repair Shop (Name Withheld)
FIND OUT WHAT YOUR SHOP IS LEAKING.
Connect your books in under an hour. See billed vs. tracked hours, tech-level profit, and your revenue-vs-goal tracker the same day.